I had offhandedly mentioned a statistical analysis I had run in the process of writing and implementing a custom password filter in Active Directory. It’s a method I use for most of the major changes we implement at work – application upgrades, server replacements, significant configuration changes.
To generate the “how long did this take” statistics, I use a perl script using the Time::HiRes module (_loadsimAuthToCentrify.pl) which measures microsecond time. There’s an array of test scenarios — my most recent test was Unix/Linux host authentication using pure LDAP authentication and Centrify authentication, so the array was fully qualified hostnames. Sometimes there’s an array of IDs on which to test — TestID00001, TestID00002, TestID00003, …., TestID99999. And there’s a function to perform the actual test.
I then have a loop to generate a pseudo-random number and select the test to run (and user ID to use, if applicable) using that number
my $iRandomNumber = int(rand() * 100);
$iRandomNumber = $iRandomNumber % $iHosts;
my $strHost = $strHosts[$iRandomNumber];
The time is recorded prior to running the function (my $t0 = [gettimeofday];) and the elapsed time is calculated when returning from the function (my $fElapsedTimeAuthentication = tv_interval ($t0, [gettimeofday]);). The test result is compared to an expected result and any mismatches are recorded.
Once the cycle has completed, the test scenario, results, and time to complete are recorded to a log file. Some tests are run multi-threaded and across multiple machines – in which case the result log file is named with both the running host’s name and a thread identifier. All of the result files are concatenated into one big result log for analysis.
A test is run before the change is made, and a new test for each variant of the change for comparison. We then want to confirm that the general time to complete an operation has not been negatively impacted by the change we propose (or select a route based on the best performance outcome).
Each scenario’s result set is dropped into a tab on an Excel spreadsheet (CustomPasswordFilterTiming – I truncated a lot of data to avoid publishing a 35 meg file, so the numbers on the individual tabs no longer match the numbers on the summary tab). On the time column, max/min/average/stdev functions are run to summarize the result set. I then break the time range between 0 and the max time into buckets and use the countif function to determine how many results fall into each bucket (it’s easier to count the number under a range and then subtract the numbers from previous buckets than to make a combined statement to just count the occurrences in a specific bucket).
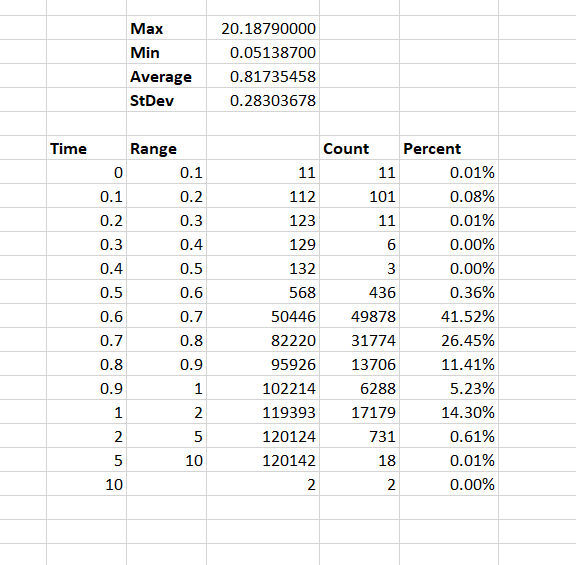
Once this information is generated for each scenario, I create a summary tab so the data can be easily compared.

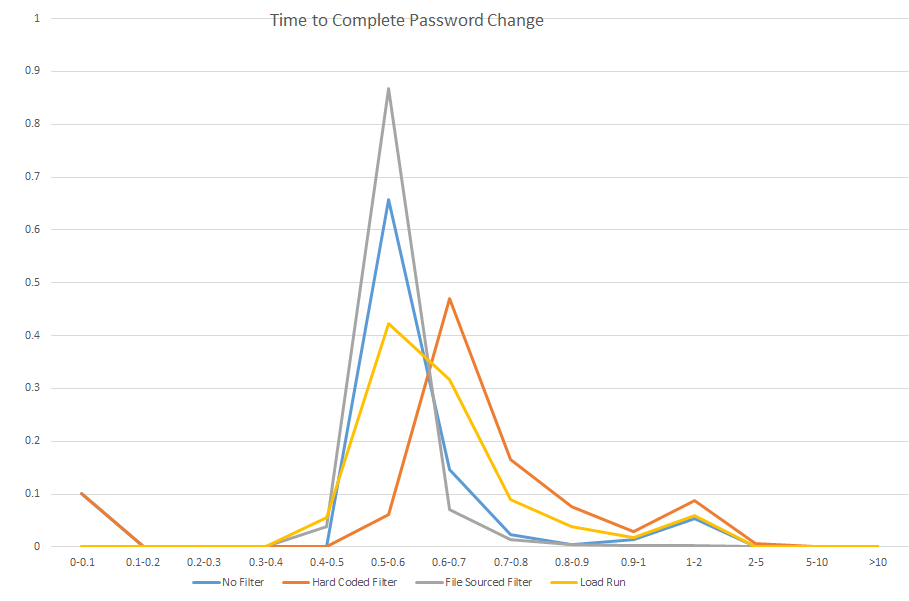
And finally, a graph is built using the lower part of that summary data. Voila, quickly viewed visual representation of several million cycles. This is what gets included in the project documentation for executive consideration. The whole spreadsheet is stored in the project document repository – showing our due diligence in validating user experience should not be negatively impacted as well as providing a baseline of expected performance should the production implementation yield user experience complaints.